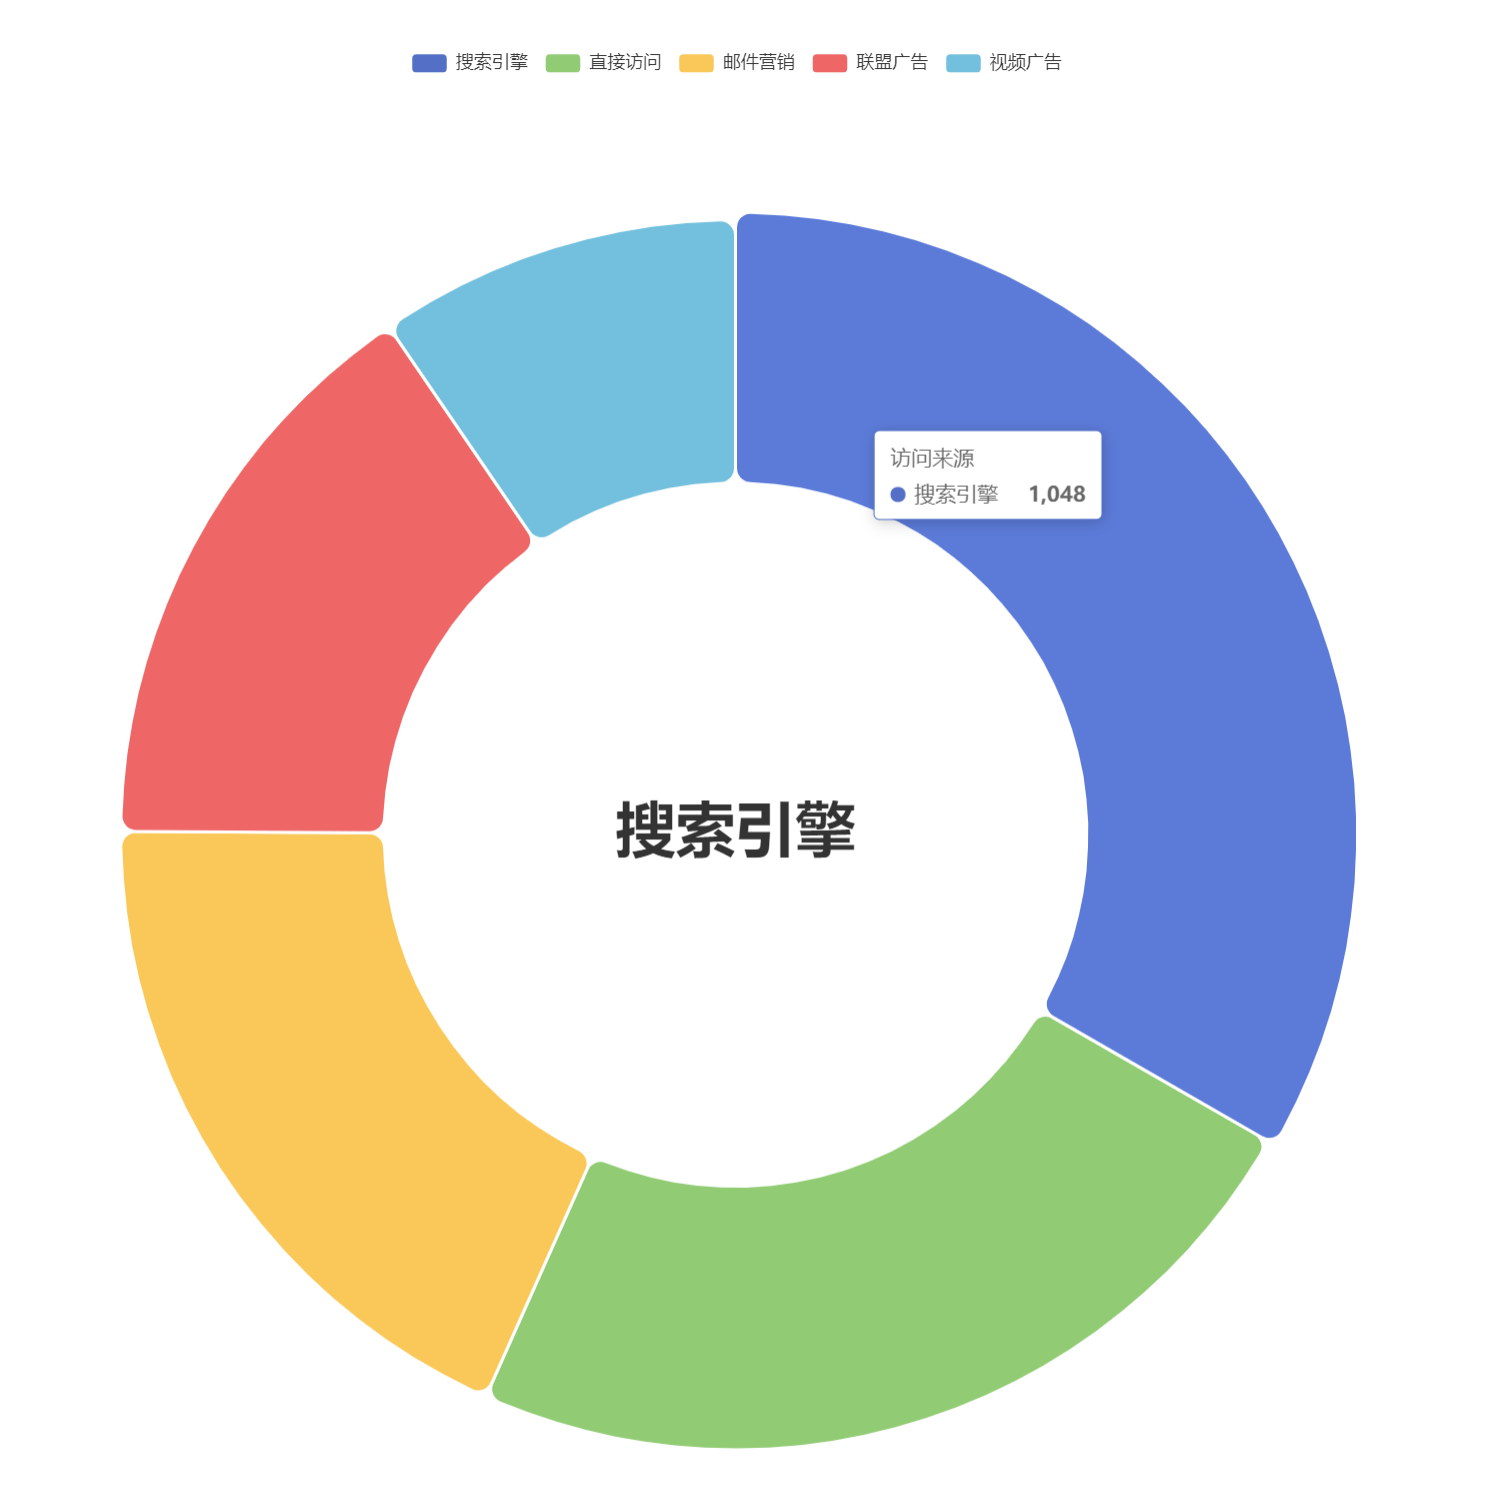
由于在项目中需要对数据进行可视化,也就是用图表展示,常用的图表插件有echarts,highcharts,这里选择了比较大众化的echarts。

所有的数据都是动态获取的,由前端向后台请求。当然请求数据肯定不会放在图表组件中,而是放在了外部。所以可以封装成组件,使用时向图表传递数据。

安装 echarts 依赖

1
2
3
4
5
6
npm install echarts -S

// 或者使用淘宝的镜像

npm install -g cnpm --registry=https://registry.npm.taobao.org
cnpm install echarts -S

创建图表

首先需要全局引入
在 main.js 中

1
2
3
// 引入 echarts
import echarts from 'echarts'
Vue.prototype.$echarts = echarts

创建组件 echarts.vue

1
2
3
<template>
<div :class="className" :style="{height:height,width:width}" />
</template>

静态写法

1
2
3
4
5
6
7
8
9
10
11
12
13
14
15
16
17
18
19
20
21
22
23
24
25
26
27
28
29
30
31
32
33
34
35
36
37
38
39
40
41
42
43
44
45
46
47
48
49
50
51
52
53
54
55
56
57
<script>
export default {
name: 'hello',
mounted() {
this.PieChart()
},
methods: {
PieChart() {
// 基于准备好的dom,初始化echarts实例
let myChart = this.$echarts.init(document.getElementById('myChart'))
// 绘制图表
myChart.setOption({
title: { text: '在Vue中使用echarts' },
tooltip: {
trigger: 'item'
},
legend: {
top: '5%',
left: 'center'
},
series: [{
name: '访问来源',
type: 'pie',
radius: ['40%', '70%'],
avoidLabelOverlap: false,
itemStyle: {
borderRadius: 10,
borderColor: '#fff',
borderWidth: 2
},
label: {
show: false,
position: 'center'
},
emphasis: {
label: {
show: true,
fontSize: '40',
fontWeight: 'bold'
}
},
labelLine: {
show: false
},
data: [
{value: 1048, name: '搜索引擎'},
{value: 735, name: '直接访问'},
{value: 580, name: '邮件营销'},
{value: 484, name: '联盟广告'},
{value: 300, name: '视频广告'}
]
}]
})
}
}
}
</script>

pie

动态写法

动态写法和静态的不同在于动态渲染数据,所以数据不能写死,需要在获取数据后渲染图表,获取数据分为两种,一种是调取接口获取,一种是通过父级传递

获取接口渲染
1
2
3
4
5
6
7
8
9
10
11
12
13
14
15
16
17
18
19
20
21
22
23
24
25
26
27
28
29
30
31
32
33
34
35
36
37
38
39
40
41
42
43
44
45
46
47
48
49
50
51
52
53
54
55
56
57
58
59
60
61
62
63
64
65
66
67
68
69
70
71
72
73
74
75
76
<script>
export default {
name: 'hello',
data () {
return {
showed: false, // option 中 title 是否展示开关
chart: null,
legend: [],
series: []
}
},
computed: {
options() { // 将图表的配置写在 computed 中,将需要动态渲染的值留空
const option = {
title: {
show: this.showed,
text: '暂无数据',
x: 'center',
y: 'center',
textStyle: {
color: '#909399',
fontWeight: 'normal',
fontSize: 14
}
},
tooltip: {
trigger: 'item',
backgroundColor: '#fff',
formatter: '{a} <br/>{b} : {c} ({d}%)'
},
legend: {
left: 'center',
bottom: '10',
data: []
},
series: [
{
name: '访问来源',
type: 'pie',
roseType: 'radius',
radius: [15, 95],
center: ['50%', '38%'],
animationEasing: 'cubicInOut',
animationDuration: 2600,
data: []
}
]
}
return option
}
},
methods: {
getChartData() {
getChartData().then(response => {
const data = response.response
if (data.length) { // 判断 data 有没有数据,当 data 有数据时给图表赋值
data.forEach(item => {
this.legend.push(item.cate_name)
this.series.push({ value: item.total, name: item.cate_name })
})
this.options.legend.data = this.legend
this.options.series[0].data = this.series
this.showed = false
this.initChart()
} else {
this.showed = true
}
})
},
initChart() {
this.chart = this.$echarts.init(this.$el, 'macarons')
this.chart.setOption(this.options)
}
}
}
</script>
父级传参渲染

父级传参可能会遇到一个页面使用多个饼图图表,此时你会发现:如果还按照上面这种写法会出现只有一个图表宽高不是默认的问题,所以可以每一次都重新定义图表的配置项

1
2
3
4
5
6
7
8
9
10
11
12
13
14
15
16
17
18
19
20
21
22
23
24
25
26
27
28
29
30
31
32
33
34
35
36
37
38
39
40
41
42
43
44
45
46
47
48
49
50
51
52
53
54
55
56
57
58
59
60
61
62
63
64
65
66
67
68
69
70
71
72
73
74
75
76
77
78
79
80
81
82
83
84
85
86
87
88
<script>
export default {
name: 'hello',
props: {
className: {
type: String,
default: 'chart'
},
width: {
type: String,
default: '100%'
},
height: {
type: String,
default: '300px'
},
name: {
type: String,
default: '漏洞'
},
chartData: {
type: Array,
default: () => { [] }
}
},
data () {
return {
chart: null
}
},
watch: {
chartData: {
deep: true, // 深度监听数据是否发生变化
handler(val) {
this.setOptions(val) // 当父级传递过来的数据发生变化,重新渲染图表
}
}
},
created() {
this.initChart()
},
mounted() {
this.initChart()
},
beforeDestroy() {
if (!this.chart) {
return
}
this.chart.dispose()
this.chart = null
},
methods: {
initChart() {
const newPromise = new Promise((resolve) => {
resolve()
})
newPromise.then(() => {
this.chart = this.$echarts.init(this.$el, 'macarons')
this.setOptions()
})
},
setOptions(data) {
data = this.chartData
const showed = data.length === 0
let type = ''
if (data.length === 0) {
type = ''
} else {
type = 'pie'
}
this.chart.setOption({
title: { show: showed, text: '暂无数据', x: 'center', y: 'center',
textStyle: { color: '#909399', fontWeight: 'normal', fontSize: 14 }},
tooltip: { backgroundColor: '#fff', trigger: 'item' },
legend: { type: 'scroll', icon: 'rect', itemWidth: 12, itemHeight: 10, orient: 'horizontal', bottom: '0', left: 'center' },
series: [{ // this.name 是父级传递过来的数据,在 props 中
name: this.name, type: type, radius: ['40%', '70%'], avoidLabelOverlap: false,
itemStyle: { borderRadius: 10, borderColor: '#fff', borderWidth: 2 },
label: { show: false, position: 'center' },
emphasis: { label: { show: true, fontSize: '20', fontWeight: 'bold' }},
labelLine: { show: false },
data: data
}]
})
}
}
}
</script>
无数据渲染

当图表没有数据时渲染可能会出现一个灰色的圈
null
我去看了 echarts 官网 api,发现当 series 中的 data 为空时会出现一个灰色的圈,
example
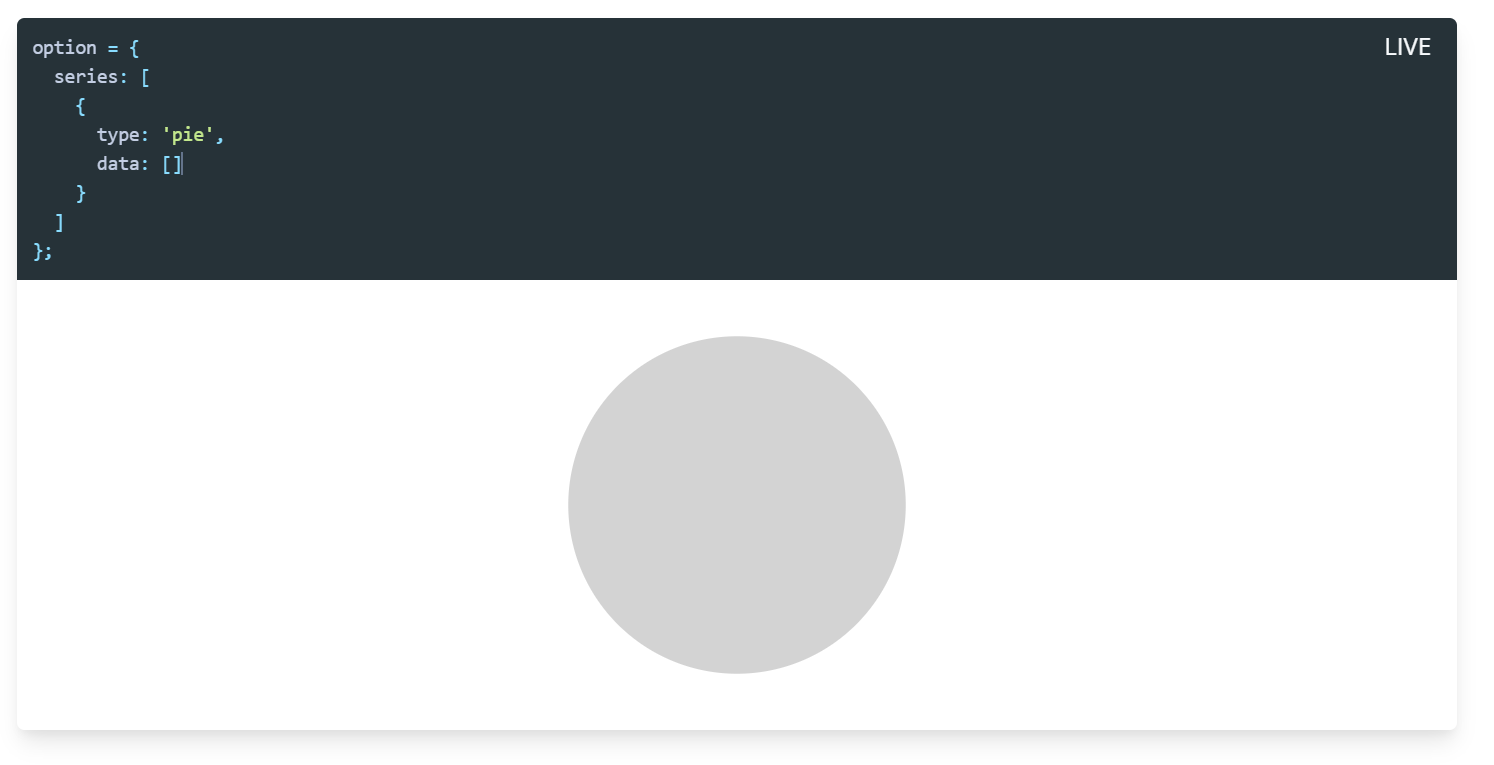
但当 type 为 ‘’ 时,灰色的圈就不见了
type=null

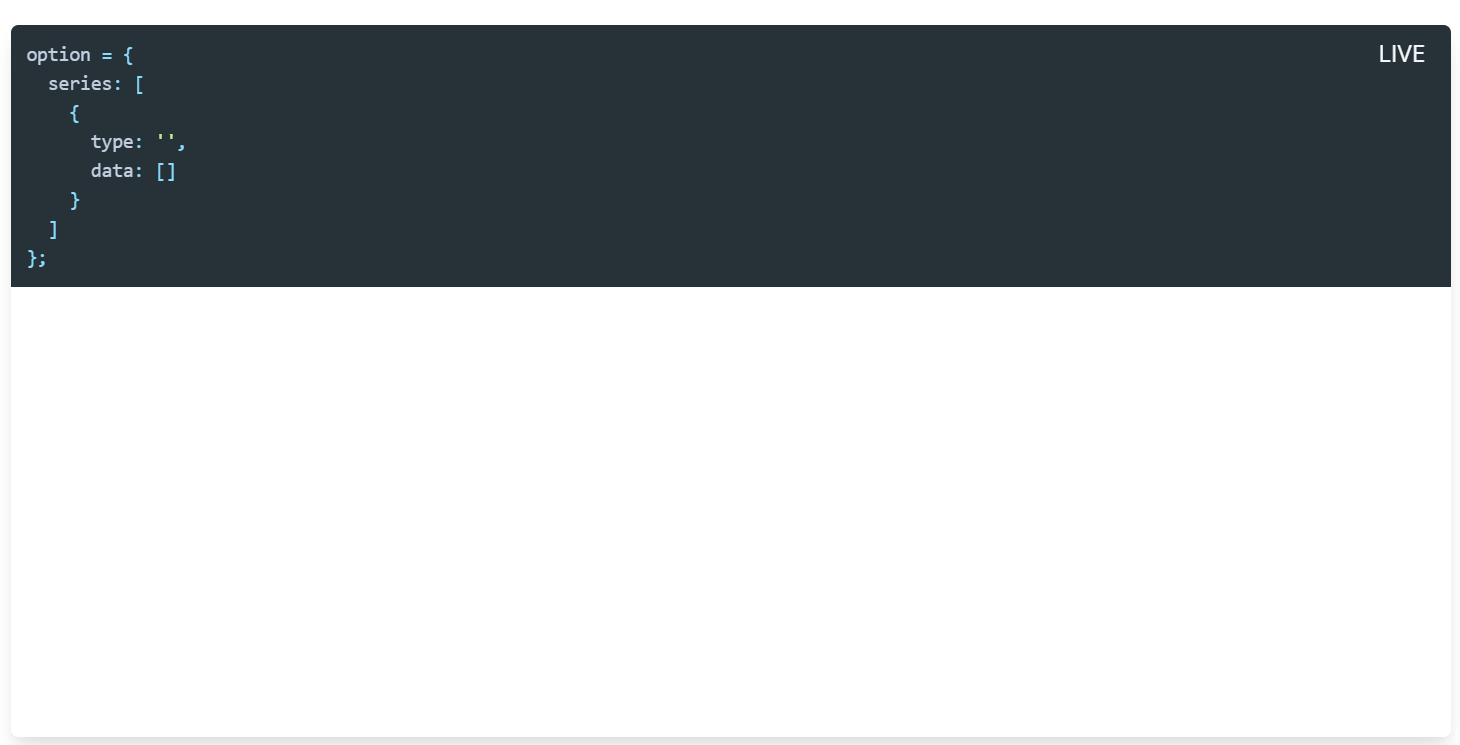
但实际上使用时还是会有问题,所以我单独写了一个 div 用来放 暂无数据 这个字段
通过 eventBus 来传递数据给父级元素,当数据为空时直接展示 暂无数据
这个是在当前页获取数据时用的,如果是父级传参过来的话,直接在父级获取参数的地方做判断就可以了

1
2
3
4
5
6
7
8
9
10
11
// 在获取参数的接口做判断,当 data 没有数据就给父级传参
getChartData() {
getChartData().then(response => {
const data = response.response
if (data.length) {
...
} else {
this.$EventBus.$emit('aMsg', true)
}
})
}

关于 eventBus 可以去参考我的 vue组件通信,如果你没找到这篇那就说我在重新整理文章,毕竟最开始对一些 api 没有过多了解,现在有了一些深入了解,和之前的想法也不一样了